World
Average life evaluations from the Gallup World Poll's annual survey are available in the World Happiness Report. Here you can see how countries' happiness has changed over time. Use the buttons or drop-down below to select groups of countries.Canada
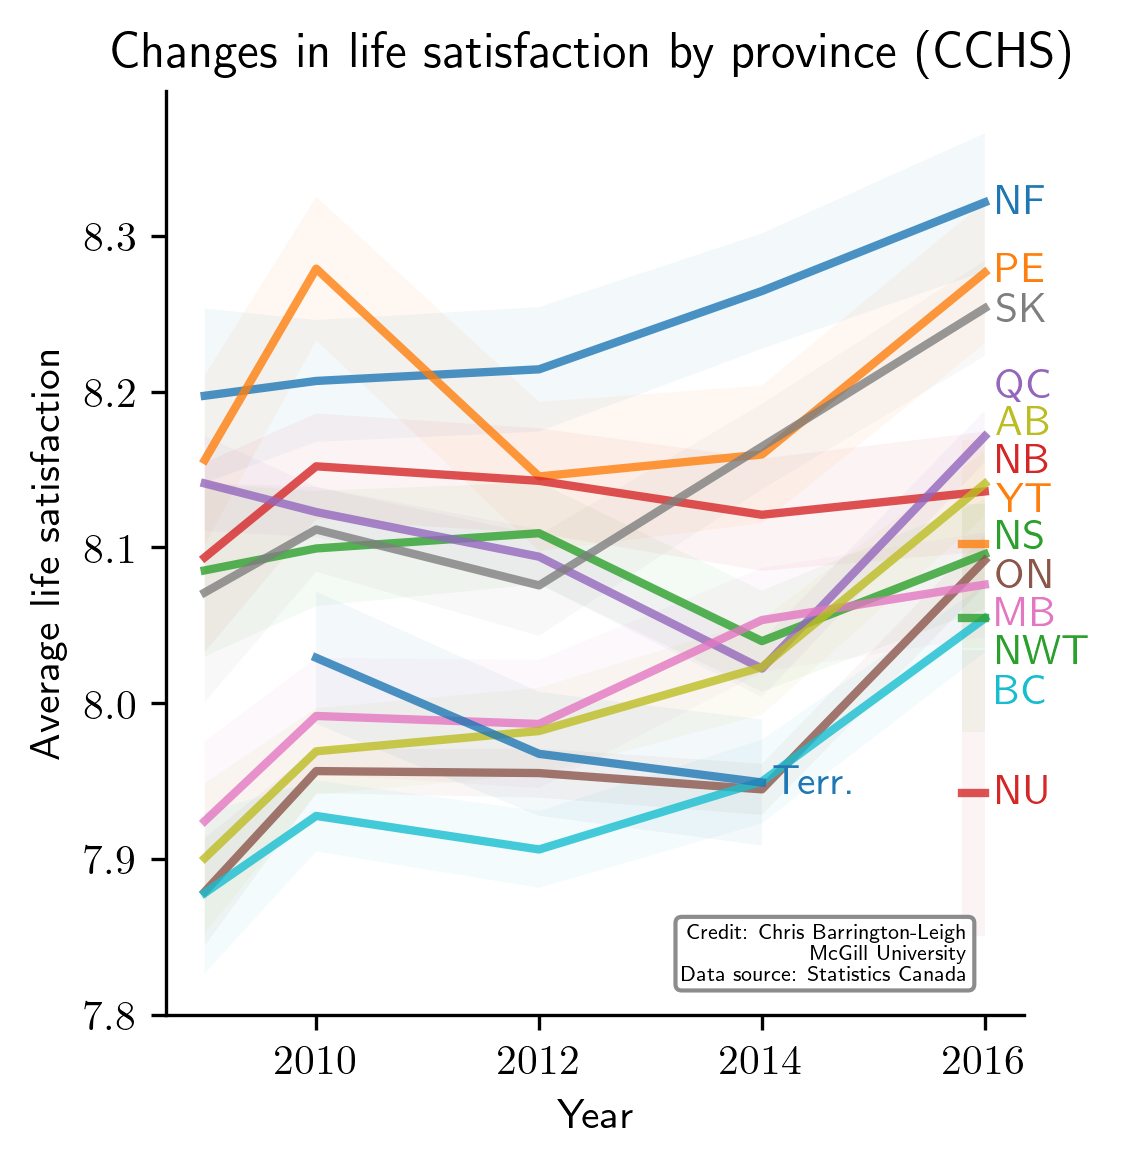
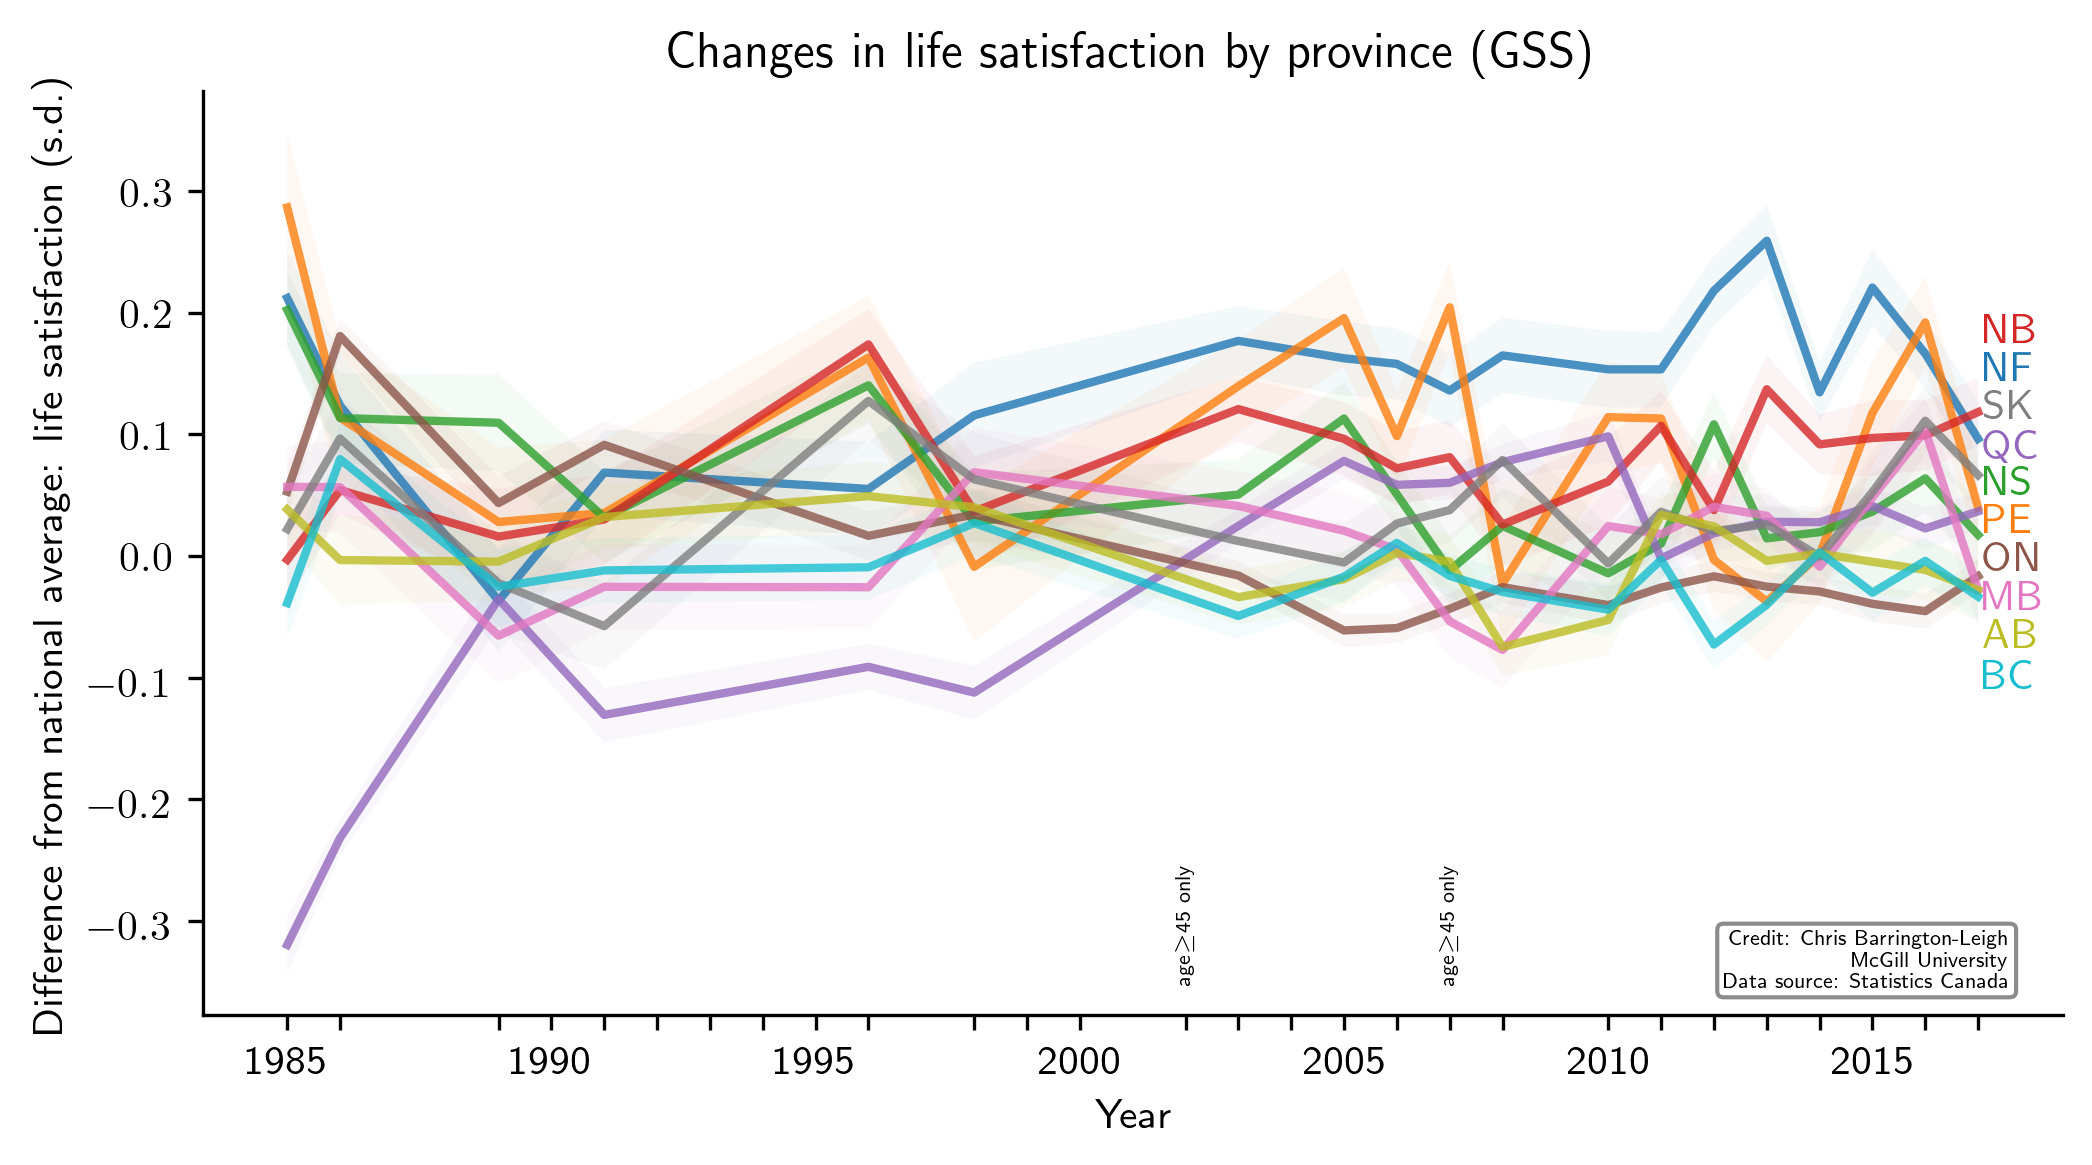
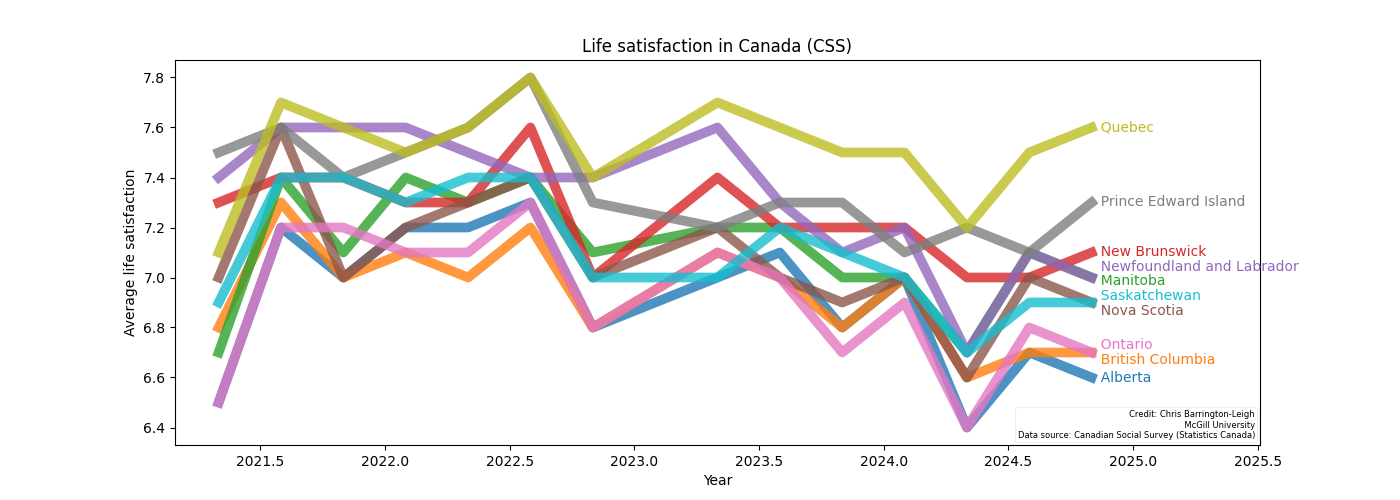
Below are displayed trends from Statistics Canada data from three ongoing repeated cross-section surveys, the Canadian Community Health Survey (CCHS) the General Social Survey (GSS), and the Canadian Social Survey (CSS, since the pandemic), along with data for Canada from the Gallup World Poll, as in the interactive plot above..
The CCHS includes the Territories separately in the most recent cycle, but in previous public releases, data for the territories were combined ("Terr." in the plot below).
Unlike on the CCHS, questions on the GSS change from year to year. The different survey content may have some effect on people's answer to the life satisfaction question, so the GSS data plotted below show average difference for each province from the yearly national average. The difference is measured in standard deviations. The GSS data, which are also from smaller samples than CCHS, may be considered to be less precise than the CCHS, but they have the advantage of going back further in time.
The shaded bands around each line represent confidence intervals, reflecting the size of the sample and its variance in each province and territory. The CSS data do not have confidence intervals yet (Stat Can rounds the confidence intervals inappropriately in their currently-available release).
Commentary:
Overall, there is a remarkable rise over time in most provinces since the 11-point life satisfaction question was deployed in the CCHS (2009).
In general, the larger provinces, except for Quebec and possibly Alberta, have lower life satisfaction. Also in general, the patterns (rankings) from CCHS and GSS agree fairly well, with the exception of Alberta. Update, as of 2024: CSS data show Quebecers reporting higher life satisfaction than even the smaller / Atlantic provinces.
The answers to the Life Satisfaction question tend to be slightly higher than those in the international data (above), which are from responses to an alternative wording for eliciting overall life evaluations, the Cantril's Ladder question. The latter form is used in Gallup's World Poll, while Statistics Canada uses Life Satisfaction. In the plot below, sample sizes are also only 1000 per year for the GWP, and about 100 times large for CCHS.


The GSS plot above can be considered to be an update of the relationships reported by
Barrington-Leigh (2013) (video animations in English and French)
N.B. If you click on the plots above, you will get them in SVG format, which means your (non-Microsoft) browser can zoom in nicely. You can also get them as PNG files here: